The Work Request Engagement dashboard provides insights into how employees are using the Connect App to submit work requests. The dashboard illustrates:
- Total requests submitted from the built-in work requests feature
- Number of users who submitted work requests
- Work request data categorized by type of space and issue
Available Insights will vary based on what features have been implemented.
Navigate to Work Request Engagement in the left navigation > 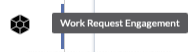
View the Available Metrics.
INSIGHTS – Available Metrics
The data includes information up to the end of the previous day.
|
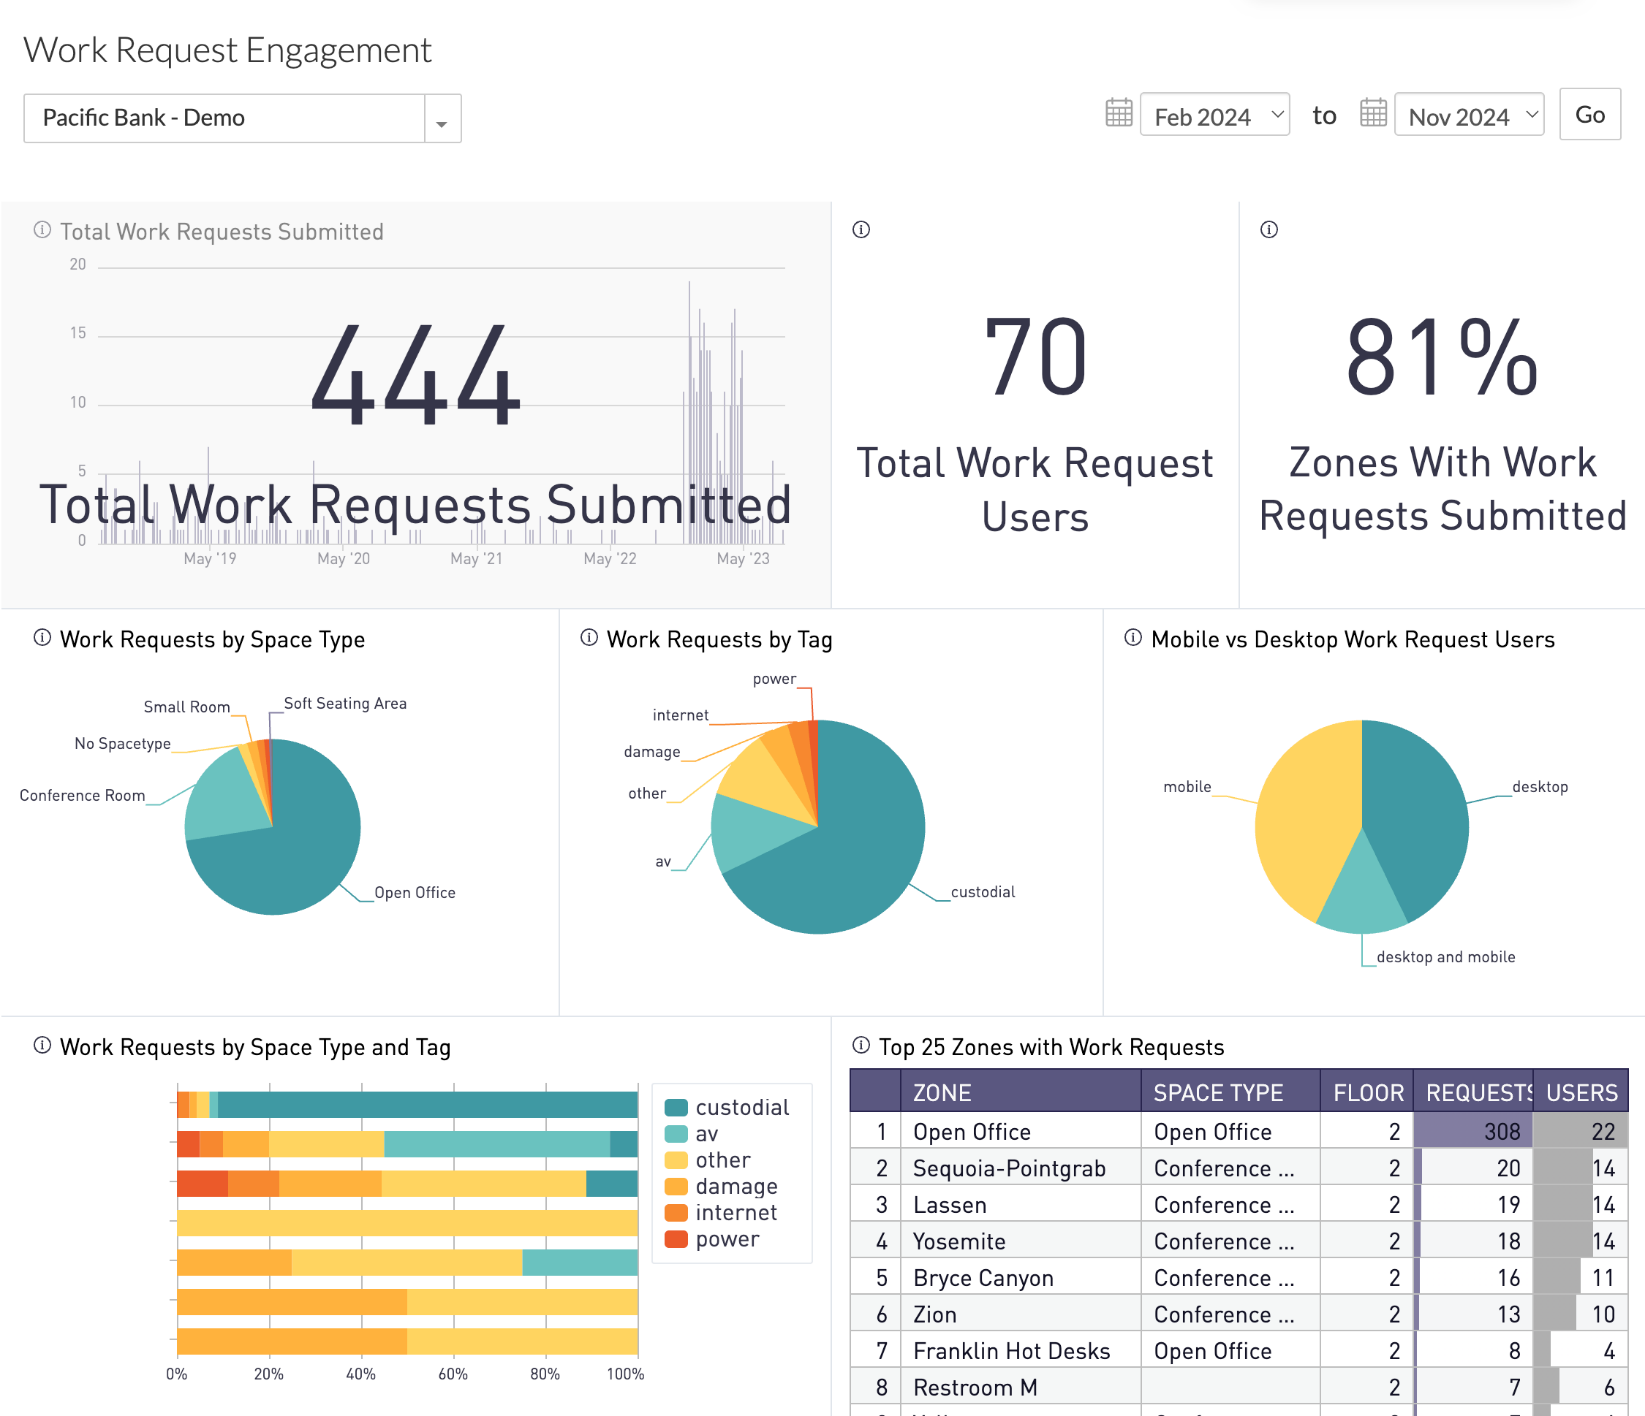
Total Work Requests Submitted
Chart shows the total number of work requests submitted by week over time. Overlay shows cumulative total in selected time frame.
|
|
|
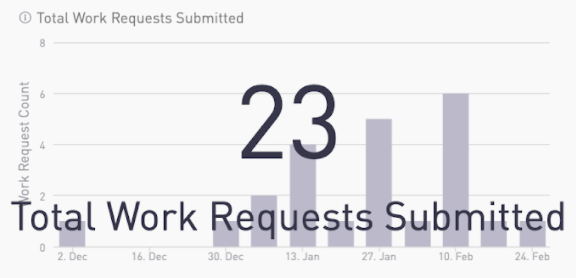
Total Work Request Users
Displays the total number of distinct users who have submitted work requests.
|
|
|
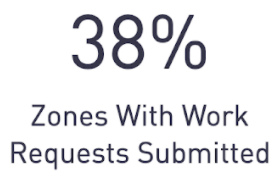
Zones With Work Requests Submitted
Displays the percentage of zones with a submitted work request. The total number of zones is the number of visible, not disabled zones, with word orders enabled.
|
|
|
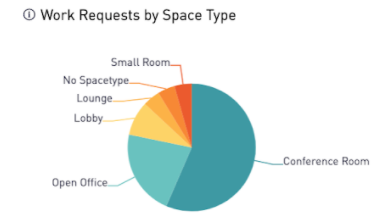
Work Requests by Space Type
Pie chart shows the distribution of space types where requests are made.
|
|
|
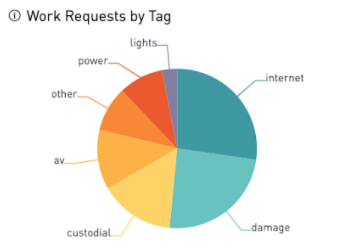
Work Requests by Tag
Pie chart shows the distribution of work request tags.
|
|
|
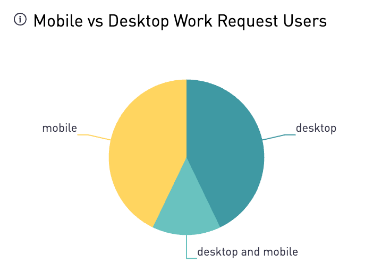
Mobile vs Desktop Work Request Users
Pie chart shows the distribution of platform usage by work request users.
|
|
|
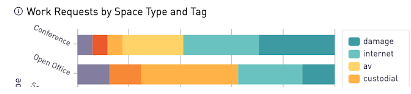
Work Requests by Space Type and Tag
Bar chart shows the request distribution by space type and tag.
|
|
|
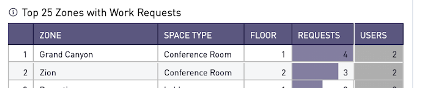
Top 25 Zones with Work Requests
Table includes the unique number of requests and users in zones with the highest number of work requests submitted.
|
|
|
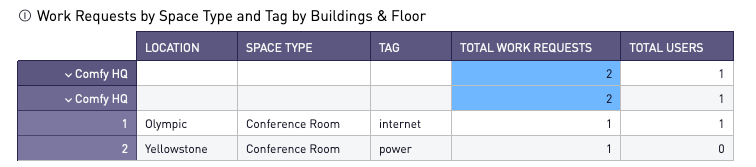
Work Requests by Space Type and Tag by Buildings & Floor
Table includes the work request distribution by space type and tag.
|
|
All Insights Dashboards

