Administrators can use the Temperature Engagement dashboard to understand the level of employee engagement with the temperature control feature:
- Number of temperature users and requests over space types
- Engagement metrics on active usage over time of day and days of the week
- Frequency of user engagement
Available Insights will vary based on what features have been implemented.
View the Available Metrics.
Navigate to the menu item Temperature Engagement >
- Select the Building and Floor
- Narrow results by Tenant
- Narrow results by Date Range
- Click the Download as PPT button to generate a PowerPoint (PPTX) file with charts for the selected building, floor, and other configured details
- Export the configured data to a CSV file
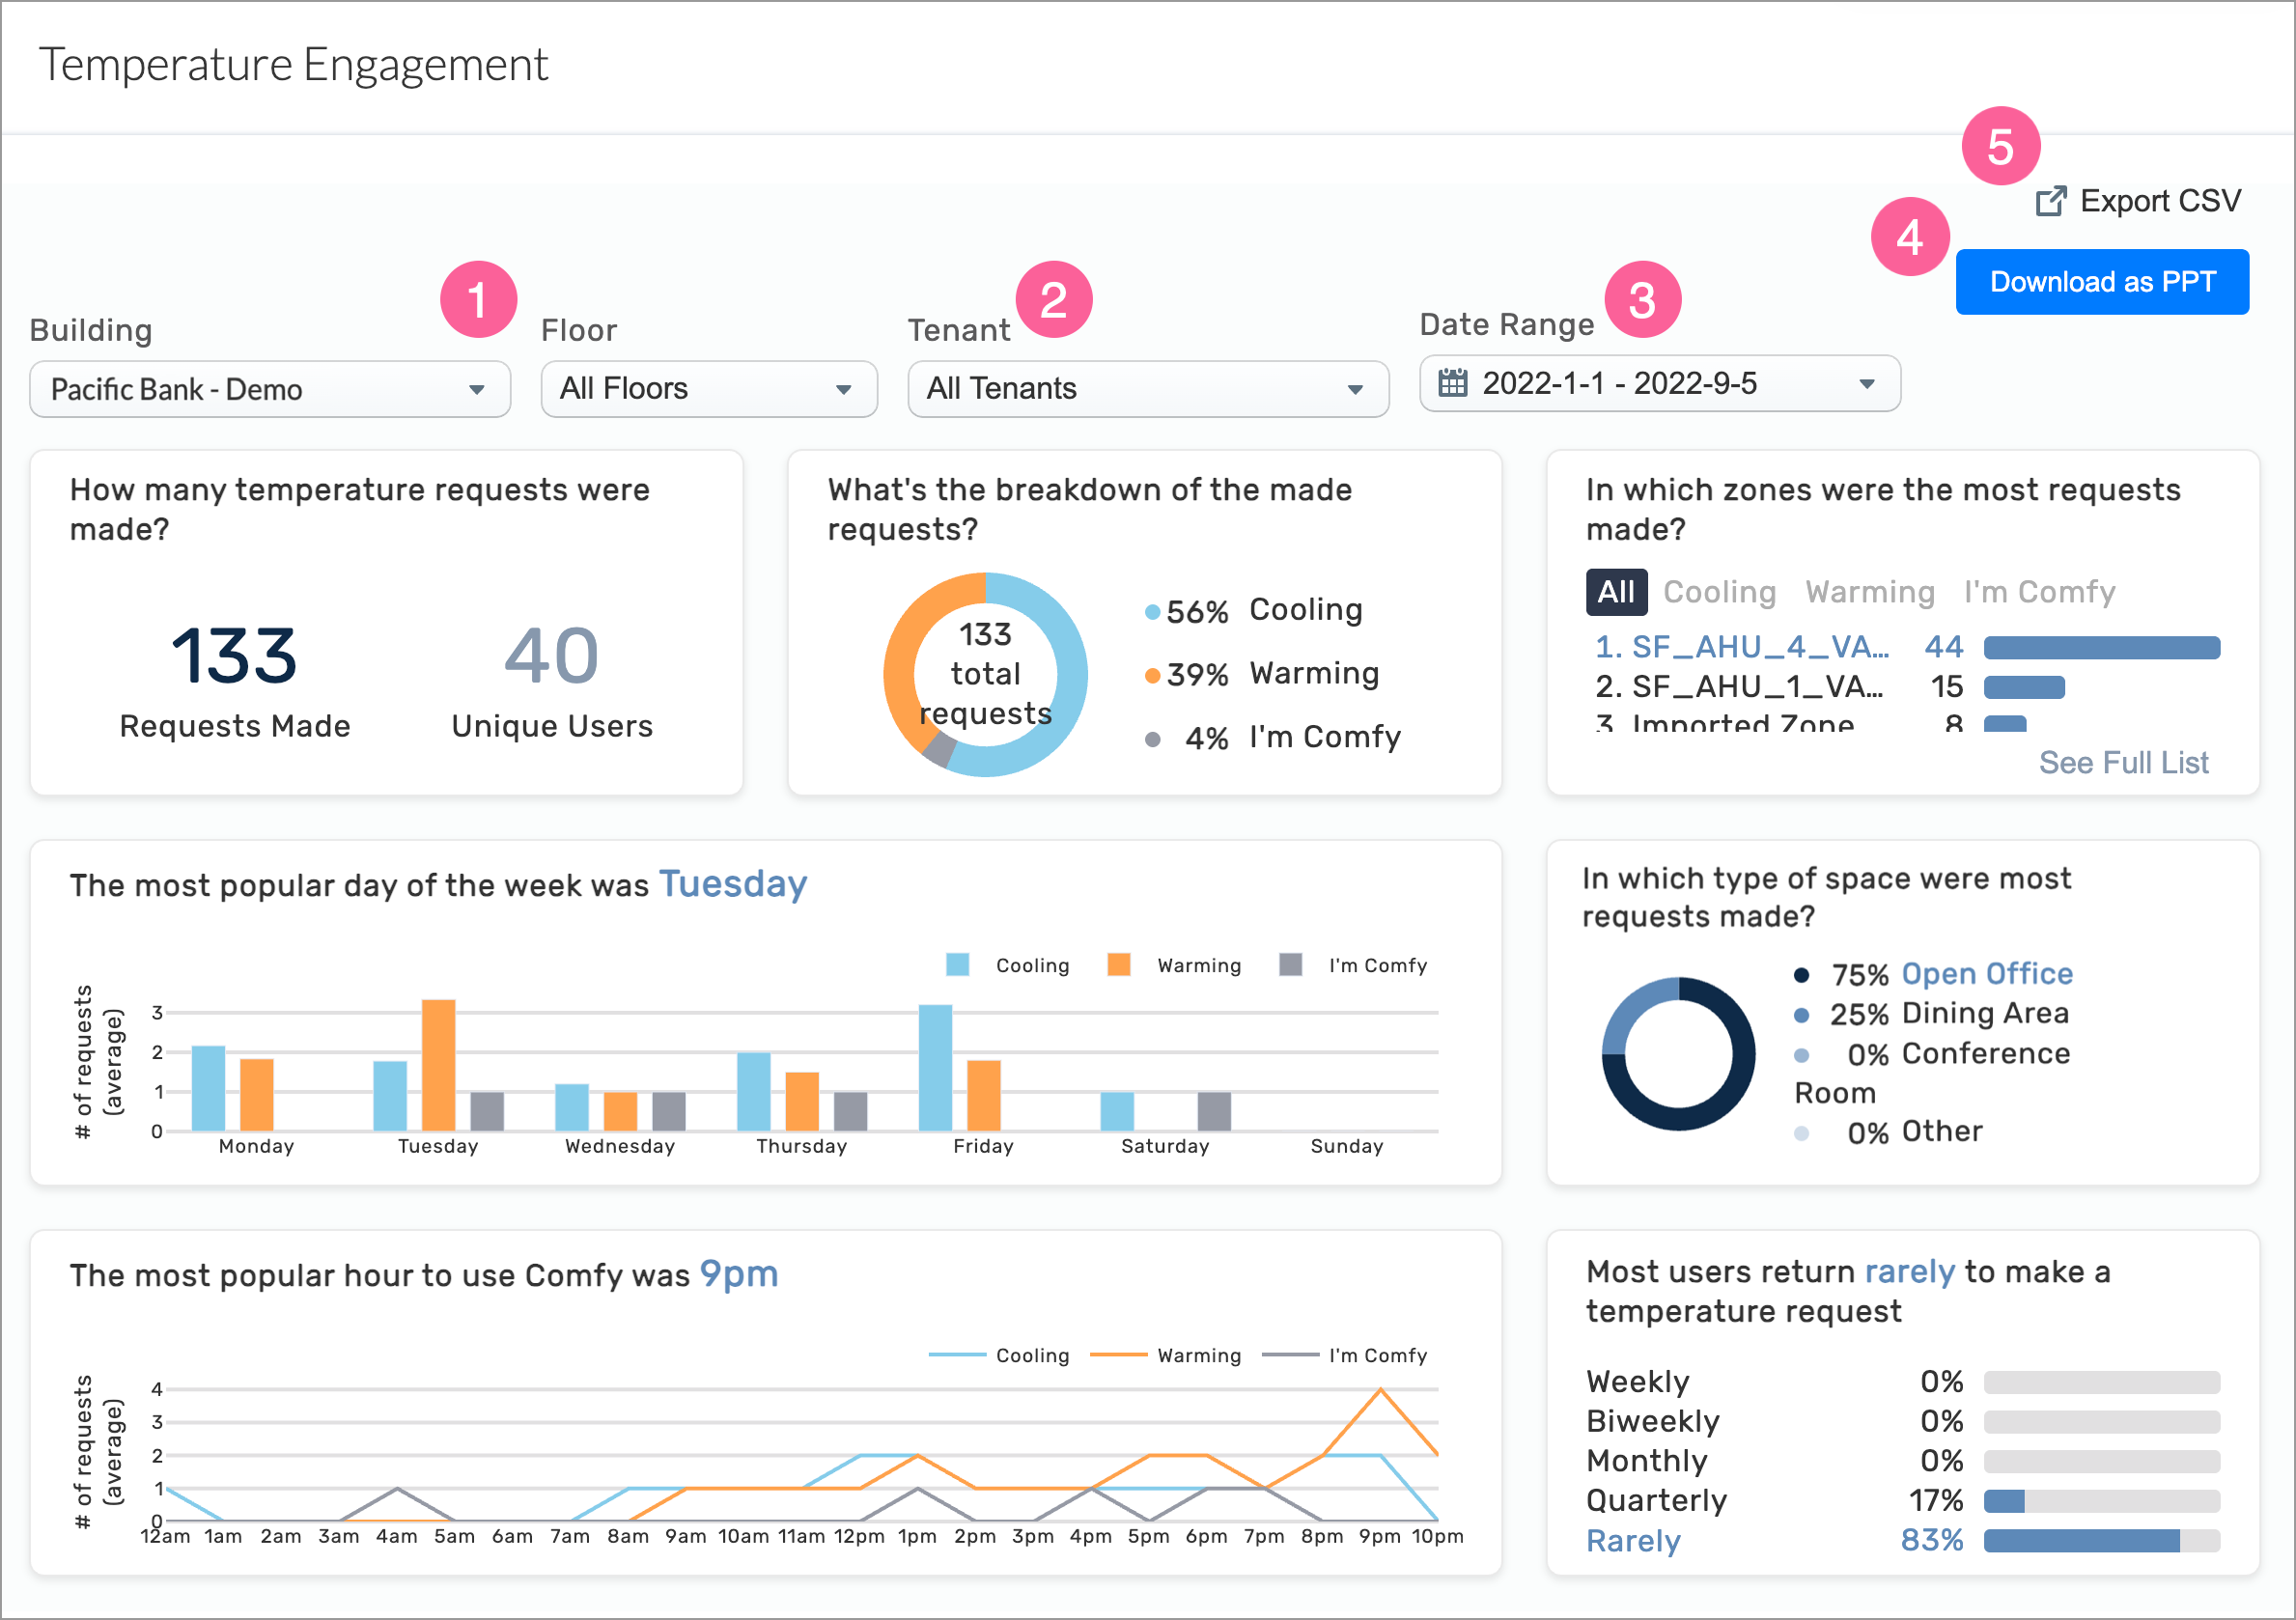
INSIGHTS – Available Metrics
The data includes information up to the end of the previous day.
|
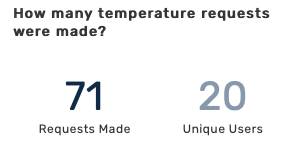
Number of temperature requests made
Displays the total number of temperature requests made by unique users within the selected parameters.
|
|
|
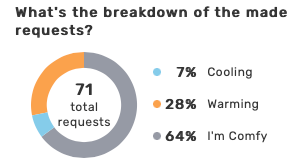
Breakdown of requests by Cooling, Warming, I’m Comfy
Displays the percentage of temperature requests by type.
|
|
|
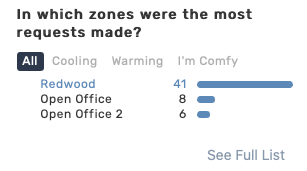
Zones of most requests
Displays the number of requests by zone. You can see requests for all zones or by temperature type.
|
|
|
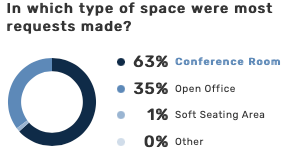
Space types of requests
Displays the percentage of requests by space type.
|
|
|
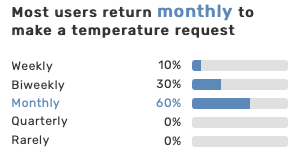
Frequency of requests
Displays the percentage of requests by time period: weekly, biweekly, monthly, quarterly, and rarely.
|
|
|
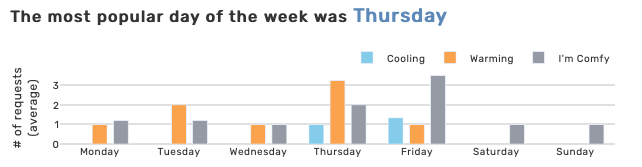
Number of requests per day
Displays the average number of request types by day of the week.
|
|
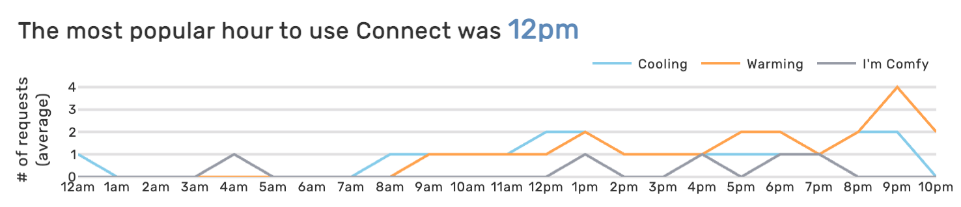
Number of requests per hour
Displays the average number of request types by hour of day.
|
All Insights Dashboards

