Administrators can use the Room Booking, Occupancy & Auto-Release Engagement dashboard to understand:
- Number of rooms available in a specific period
- How often were rooms booked
- How often each room was in use
- Most and least popular booked spaces
- If sensors are installed: occupancy by hour and room capacity (per sensor data)
- If the organization has auto-release set up with the booking system:
- Total number of rooms that were auto-released
- Number of hours recouped after being released
- Other time and status measures
Available Insights will vary based on what features have been implemented.
Navigate to the menu item > Room Booking, Occupancy & Auto-Release Engagement

View details for all Available Metrics.
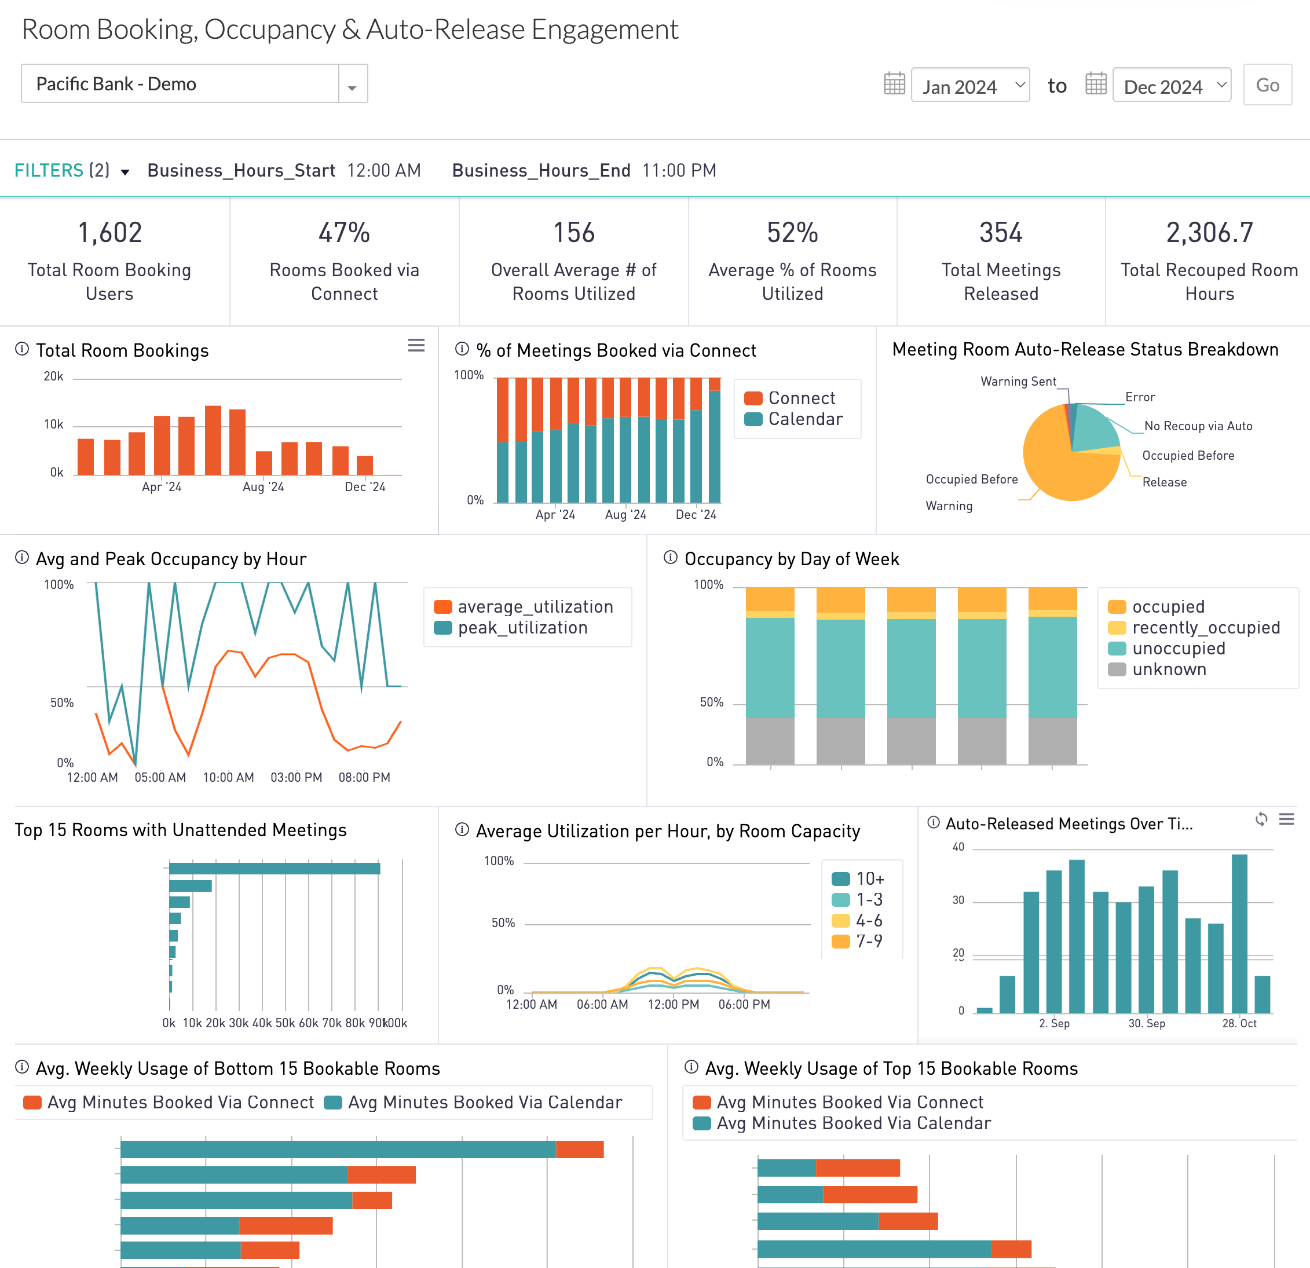
INSIGHTS – Available Metrics
The data includes information up to the end of the previous day.
|
Total Room Booking Users
Number of unique users who have booked a room via Connect
|
|
Rooms Booked via Connect
Percent of bookable rooms available in Connect that have been booked
|
|
Overall Average Number of Rooms Utilized
Overall average number of rooms with at least 25 minutes of occupancy within a one-hour time block
|
|
Average Percent of Rooms Utilized
Shows percentage of rooms occupied averaged over all hours and all business days in the selected time period. A room is considered utilized if it has more than 25 minutes of occupancy in a one-hour block. Rooms with too much unknown data are excluded.
|
|
Total Meetings Released
Total number of meetings released via the Connect auto-release feature
|
|
Total Recouped Room Hours
Total number of meeting hours reclaimed via auto-release of booked but unattended meetings
|
|
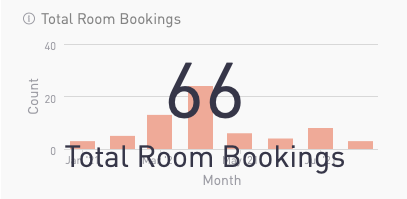
Total Room Bookings
Bar chart shows the total number of room bookings via Connect by month, over time.
Number in overlay shows the cumulative total in selected timeframe.
|
|
|
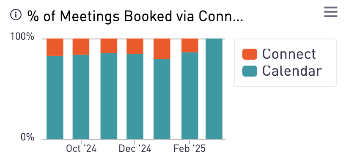
Percent of Meetings Booked via Connect
Stacked bar chart shows the percentage of meetings, by month, which are booked via Connect.
|
|
|
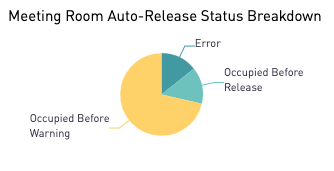
Meeting Room Auto-Release Status Breakdown
Pie chart shows the percentage of booked rooms that were occupied before a warning was issued, rooms that were occupied after the warning but before the auto-release time, and rooms without enough data. This applies to rooms that have sensors and auto-release enabled.
|
|
|
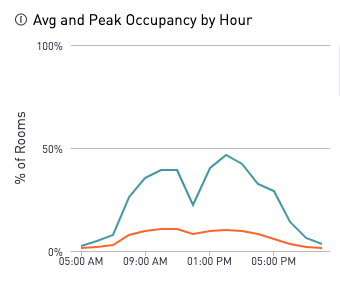
Average and Peak Occupancy per Hour
Line chart shows room occupancy by hour over all business days in the time window. Peak utilization (blue) represents the maximum percentage of rooms occupied during each hour across all business days within the specified time window.
Average utilization (orange) is the percentage of rooms occupied during each hour averaged over all business days in the time window. A room is considered utilized if it has more than 25 minutes of occupancy in a one-hour block.
|
|
|
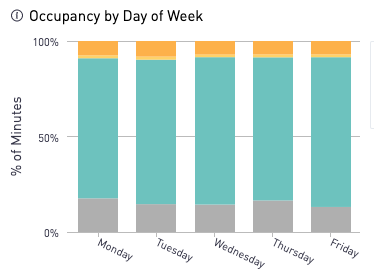
Occupancy by Day of Week
Stacked bar chart shows the average and peak percentage of rooms with at least 25 minutes of occupancy per hour, aggregated by the day of week.
|
|
|
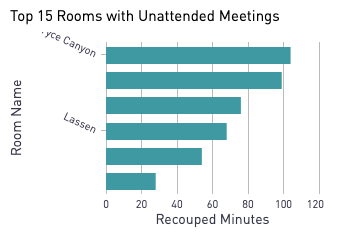
Top 15 Rooms with Unattended Meetings
Bar chart showing how many minutes various rooms have recouped from auto-release.
|
|
|
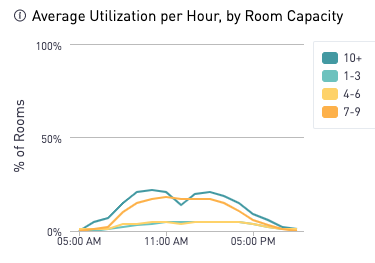
Average Utilization per Hour by Room Capacity
Line chart shows four different capacity groupings based on the average percent of rooms utilized during each hour of the day.
|
|
|
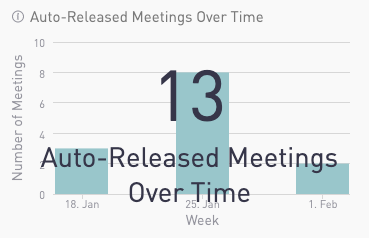
Auto-Released Meetings Over Time
Chart illustrates total number of meetings released via the Connect auto-release feature.
Number in overlay shows the cumulative total in selected timeframe.
|
|
|
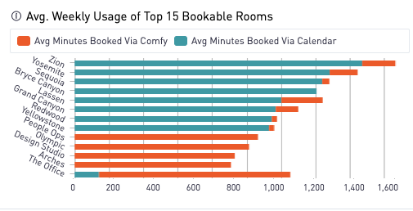
Average Weekly Usage of Top 15 Bookable Rooms
Stacked bar chart shows the average weekly usage of the most booked rooms, broken out by average minutes booked via Connect versus the calendar system. The ranking is based on the total number of meeting minutes booked.
Only rooms bookable via Connect are included.
|
|
|
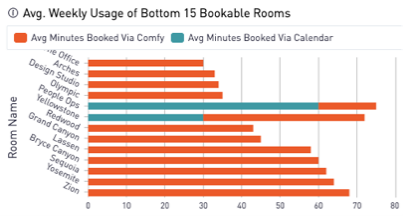
Average Weekly Usage of Bottom 15 Bookable Rooms
Stacked bar chart shows the average weekly usage of the least booked rooms, broken out by average minutes booked via Connect versus the calendar system. The ranking is based on the total number of meeting minutes booked.
Only rooms bookable via Connect are included.
|
|
|
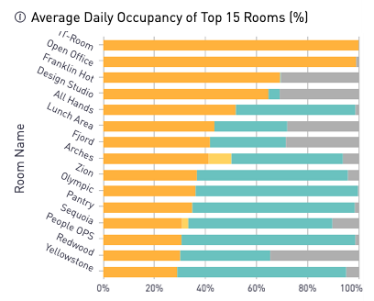
Average Daily Occupancy of Top 15 Rooms
Stacked bar chart shows the average daily occupancy of top 15 rooms. The ranking is based on the total minutes of occupancy.
|
|
|
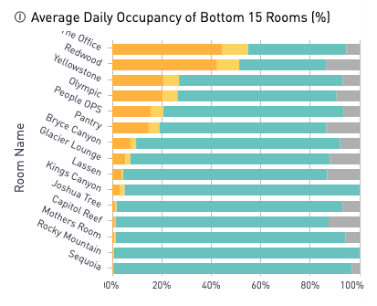
Average Daily Occupancy of Bottom 15 Rooms
Stacked bar chart shows the average daily occupancy of bottom 15 rooms. The ranking is based on the total minutes of occupancy.
|
|
All Insights Dashboards

