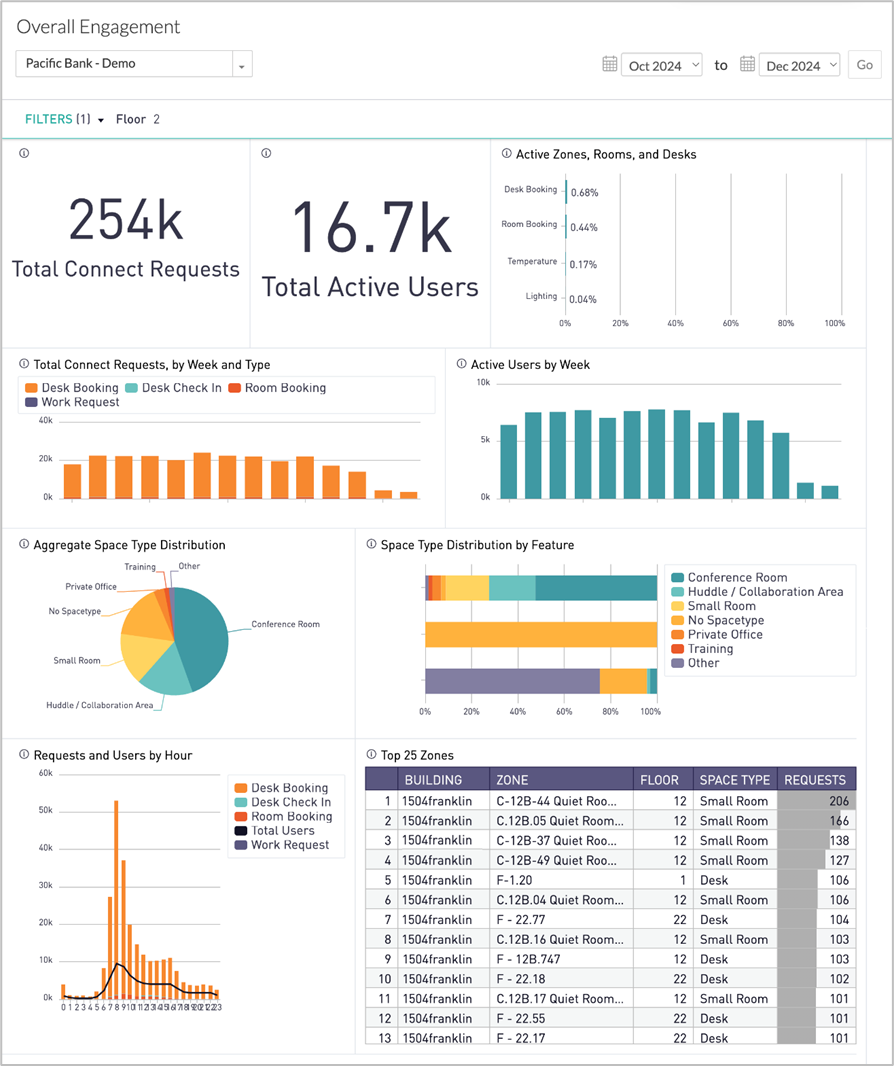
Use the Overall Engagement dashboard to learn about the environmental features users are controlling, the requests being made, and where these requests are being made. Data can reflect monthly time periods (which you can adjust), with details displayed in weekly and hourly intervals.
Available Insights will vary based on the features that have been implemented.
Go to menu item > 
|
Features are physical building elements that can be adjusted or requested from the app, including:
- Lighting
- Temperature
- Room Booking
- Work Request
Requests refer to lighting or temperature environmental adjustments, work requests, or space bookings made from the Connect app.
|
Insights – Available Metrics
The data includes information up to the end of the previous day.
|
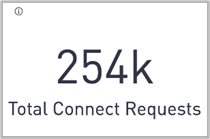
Total Connect Requests
Shows cumulative total number of environmental adjustments or work requests made in the selected time frame. Possible request types include temperature, lighting, work requests, desk bookings, and/or room bookings.
|
|
|
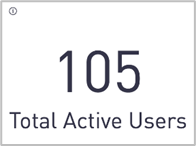
Total Active Users
Shows count of unique users who have visited the Connect App in the selected date range.
|
|
|
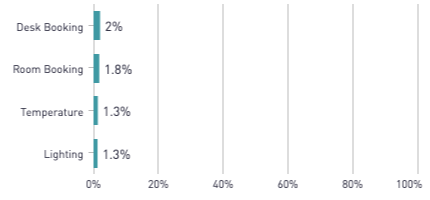
Active Zones, Rooms, and Desks
Bar chart shows what percentage of available zones, rooms, and desks received a request during the selected timeframe, broken out by feature. The total is the number of visible, not disabled zones/rooms/desks.
|
|
|
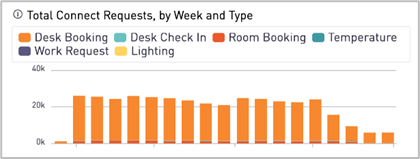
Total Connect Requests by Week and Type
Bar chart shows the total number of requests made each week, color-coded by type.
|
|
|
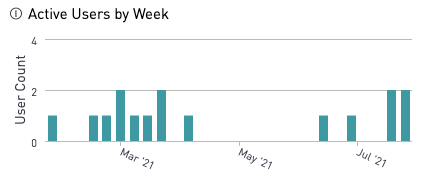
Active Users by Week
Bar chart shows the count of unique users who have visited the Connect App in the selected date range.
|
|
|
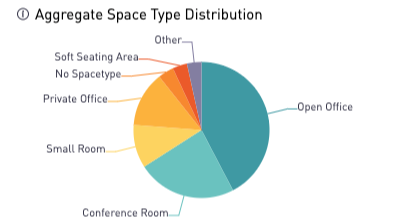
Aggregate Space Type Distribution
Pie chart shows what percent of requests were made from what space type. This chart does not include desk booking requests.
|
|
|
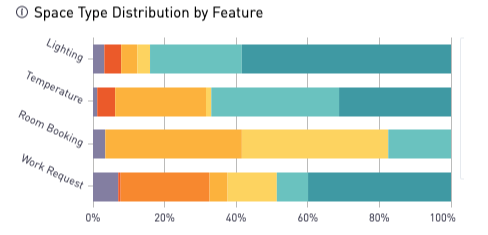
Space Type Distribution by Feature
Stacked bar chart shows the distribution of space types by number of distinct requests for each feature. This chart does not include desk booking requests.
|
|
|
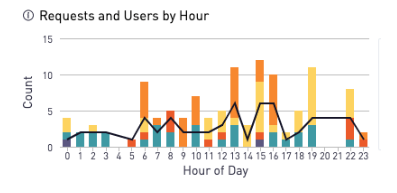
Requests and Users by Hour
Combined bar chart counting the total requests per hour for the selected week. The user count indicates the number of distinct users, per hour, who made requests.
|
|
|
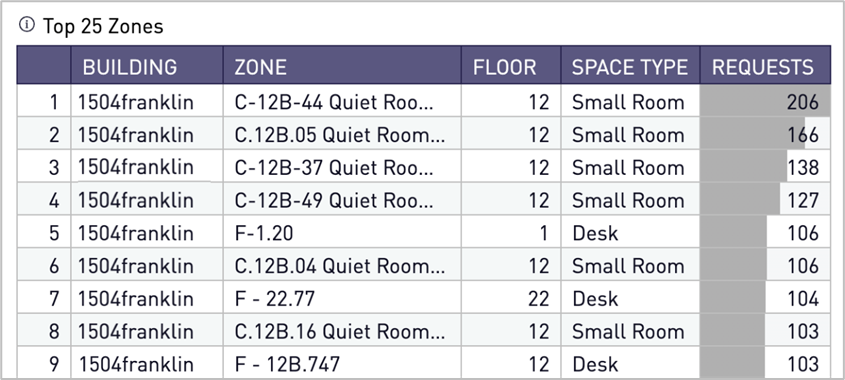
Top 25 Zones
Table includes the twenty-five most popular bookable Zones, ranked by total number of booking requests.
|
All Insights Dashboards

