Use the Desk Engagement dashboard to see how employees interact with desks using the Connect App. The dashboard displays statistics and trends over time, including the aggregate number of desks booked, the most and least popular desk types, desk booking by hour, and auto-release metrics (if enabled).
Available Insights will vary based on what features have been implemented.
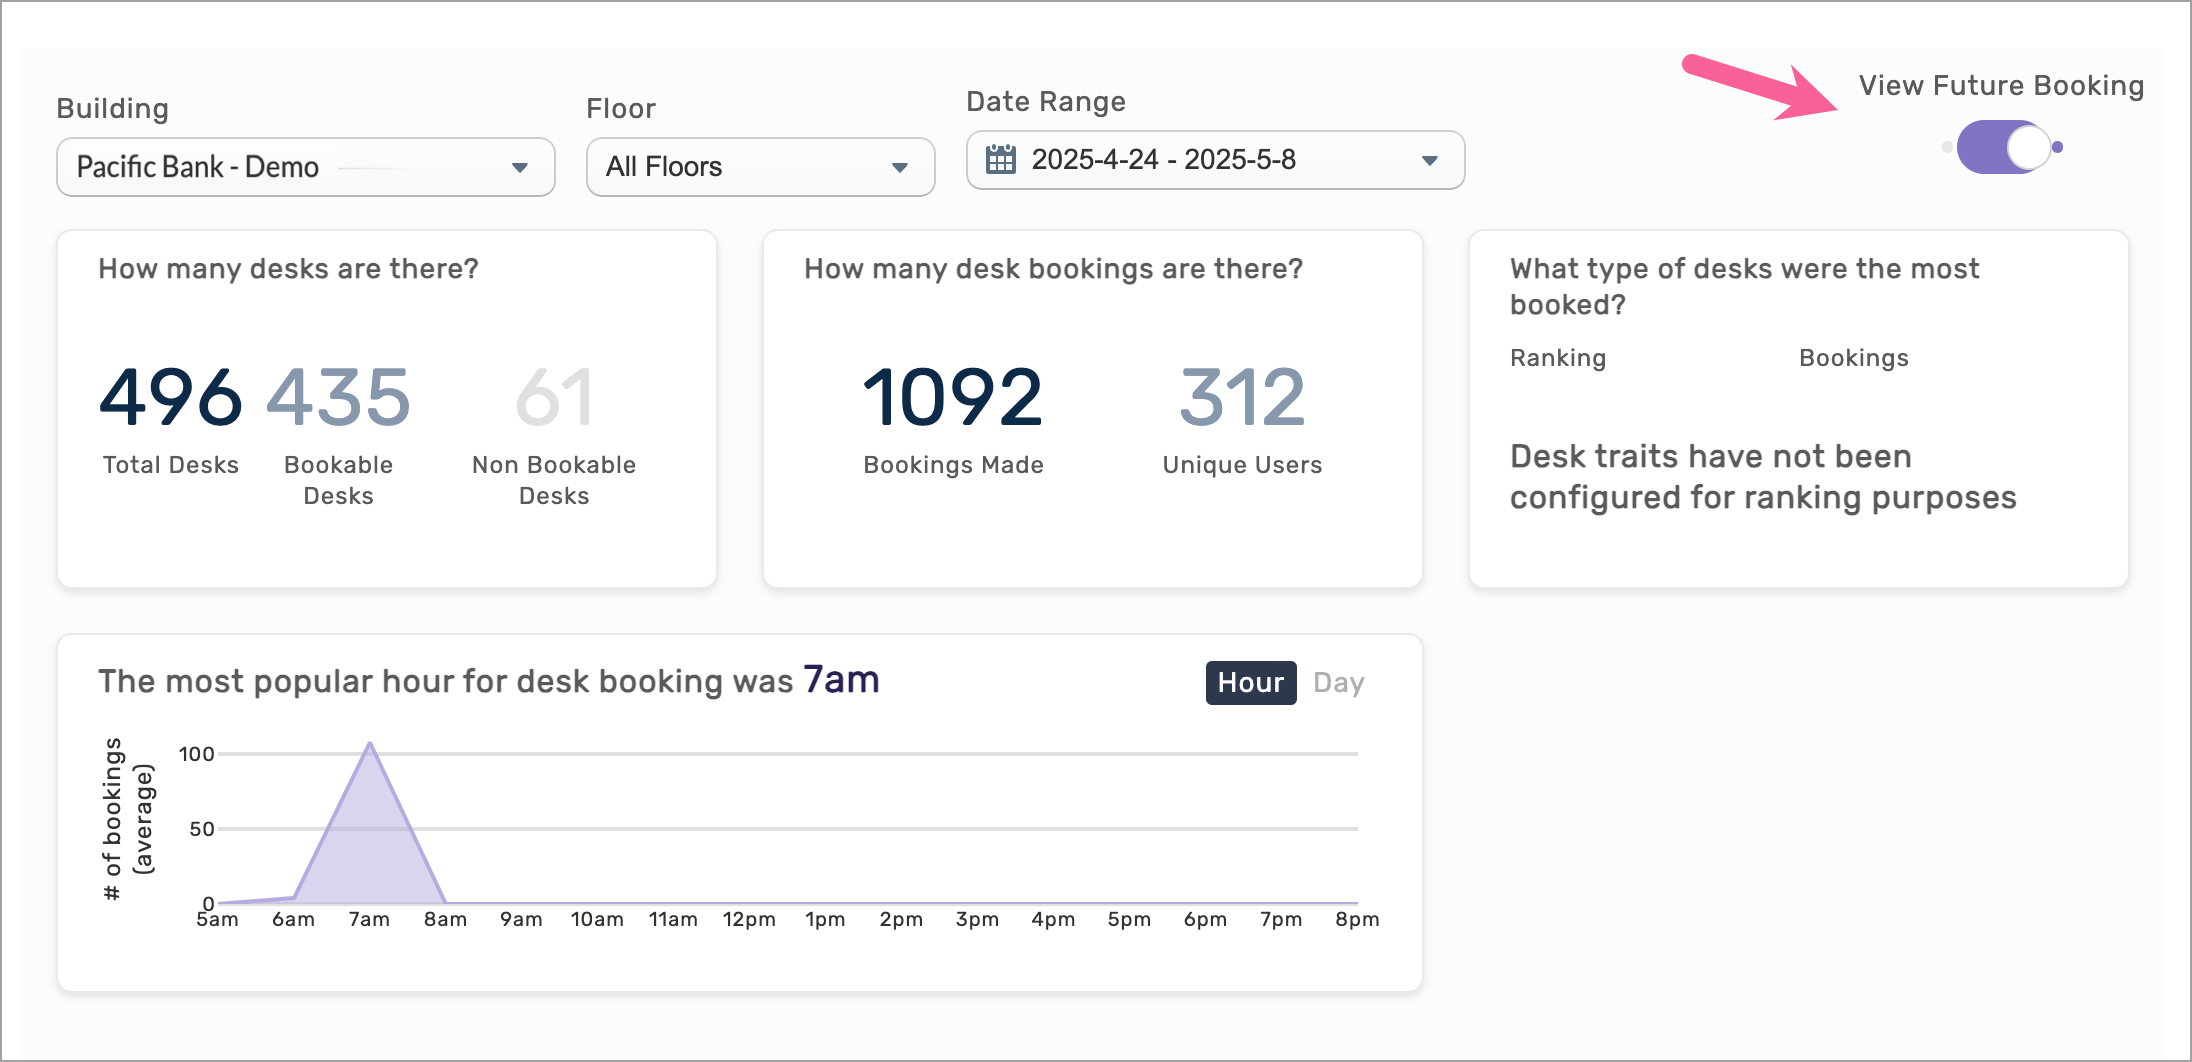
Navigate to the menu item > Desk Engagement
- Select the Building and Floor
- Narrow results by Date Range
- Click the Download as PPT button to generate a PowerPoint (PPTX) file with charts for the selected building, floor, and other configured details
- Use the View Future Booking toggle to switch from historical desk booking data to a future range of days permitted by the building’s 'Advanced Booking Period'
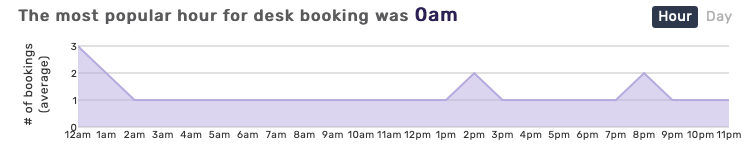
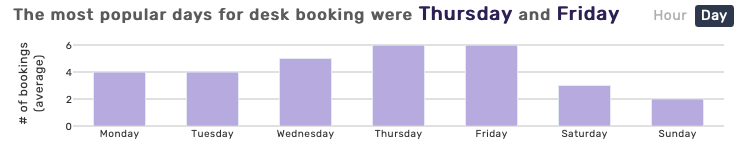
- Switch between Hours or Days most popular for desk bookings
You can hover over different areas on the charts to view booking details.
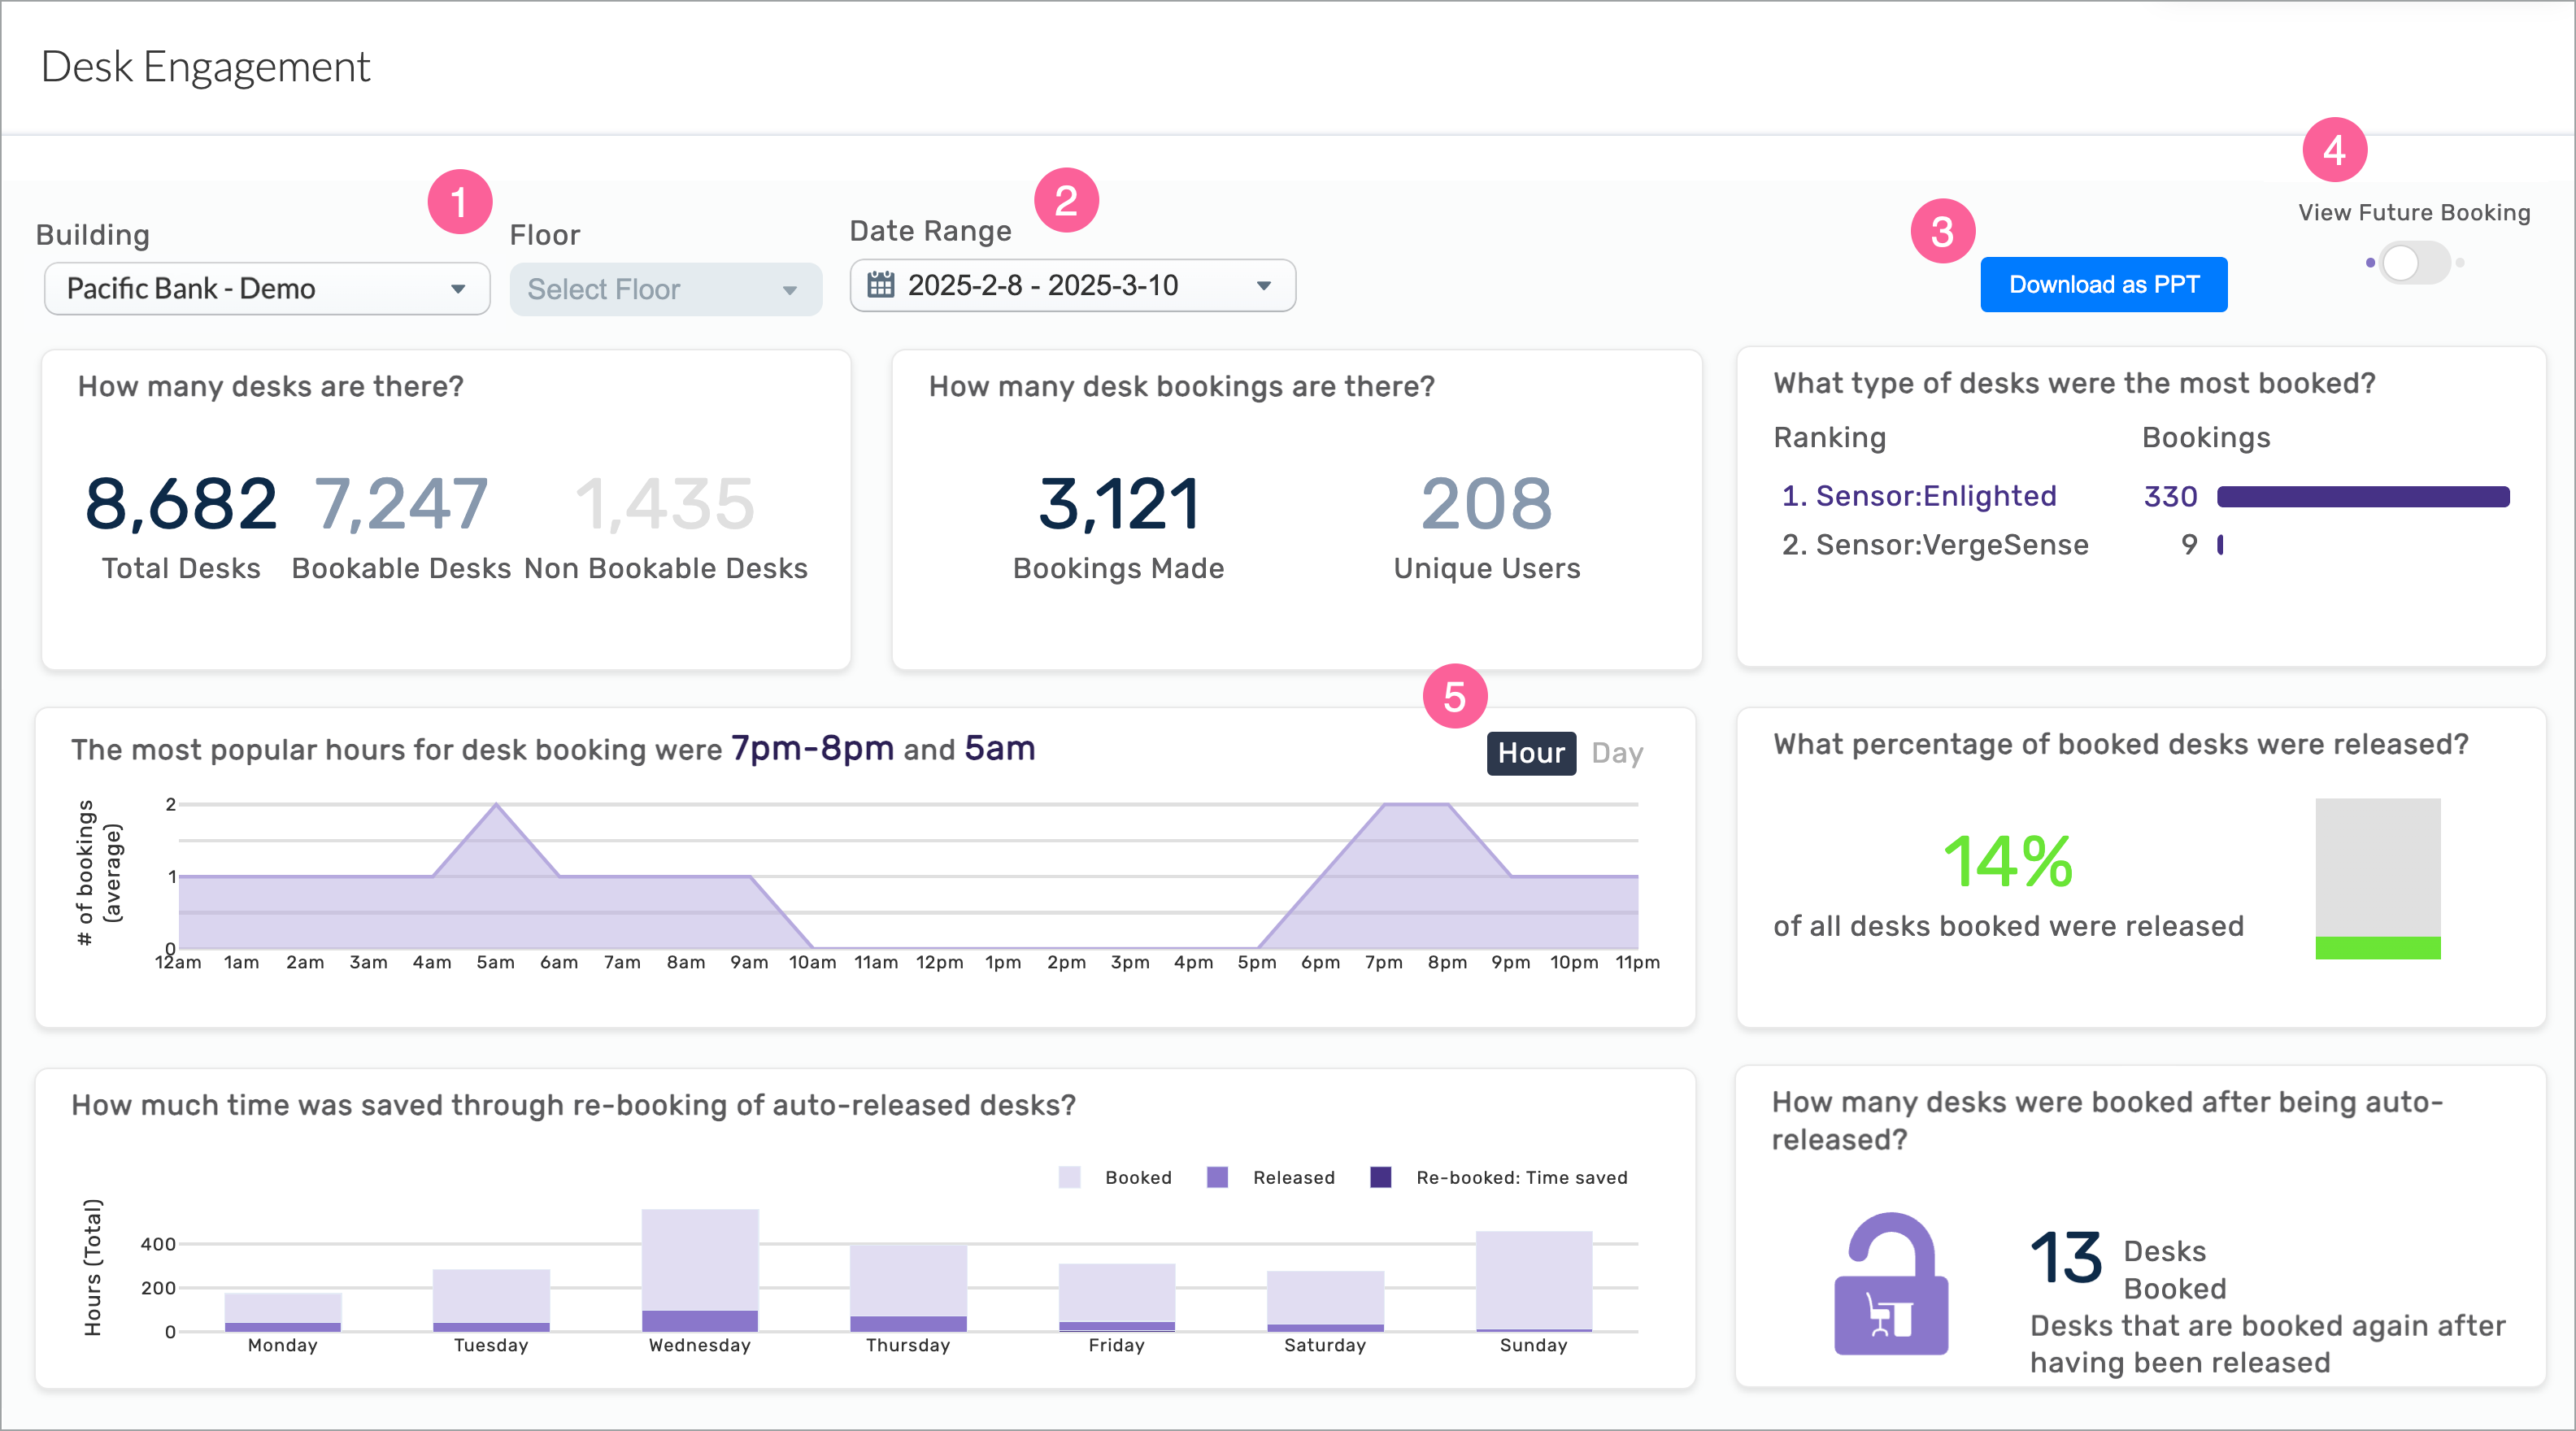
The data includes information up to the end of the previous day.
|
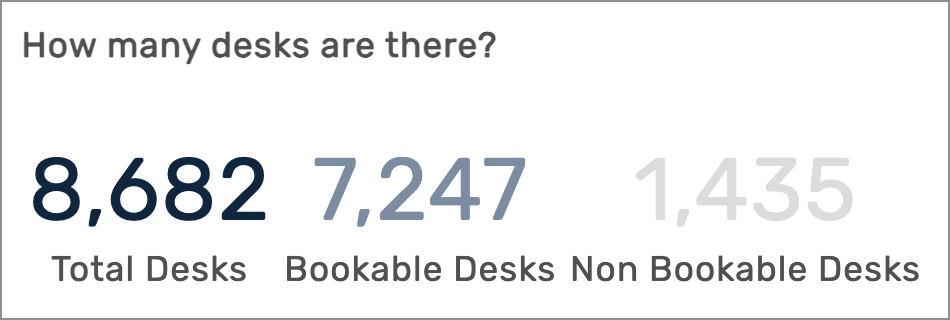
Number of desks included in metrics
Displays the total number of desks included within the parameters selected.
|
|
|
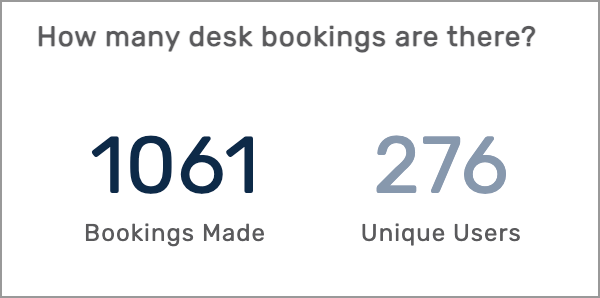
Number of desks booked
Displays the total number of desk bookings and the number of unique users included within the selected parameters.
|
|
|
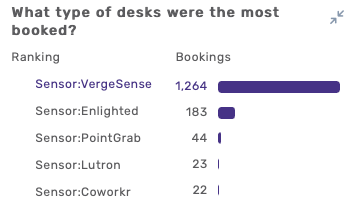
Type of desks booked most
Displays the ranking of all desk types that were booked within the parameters selected.
|
|
|
Most popular hours/days for desk booking
Chart shows the hours or days most popular for desk bookings, within the parameters selected. You can hover over different areas on the charts to view booking details.
|
If Auto-Release Is Enabled
|
|
|
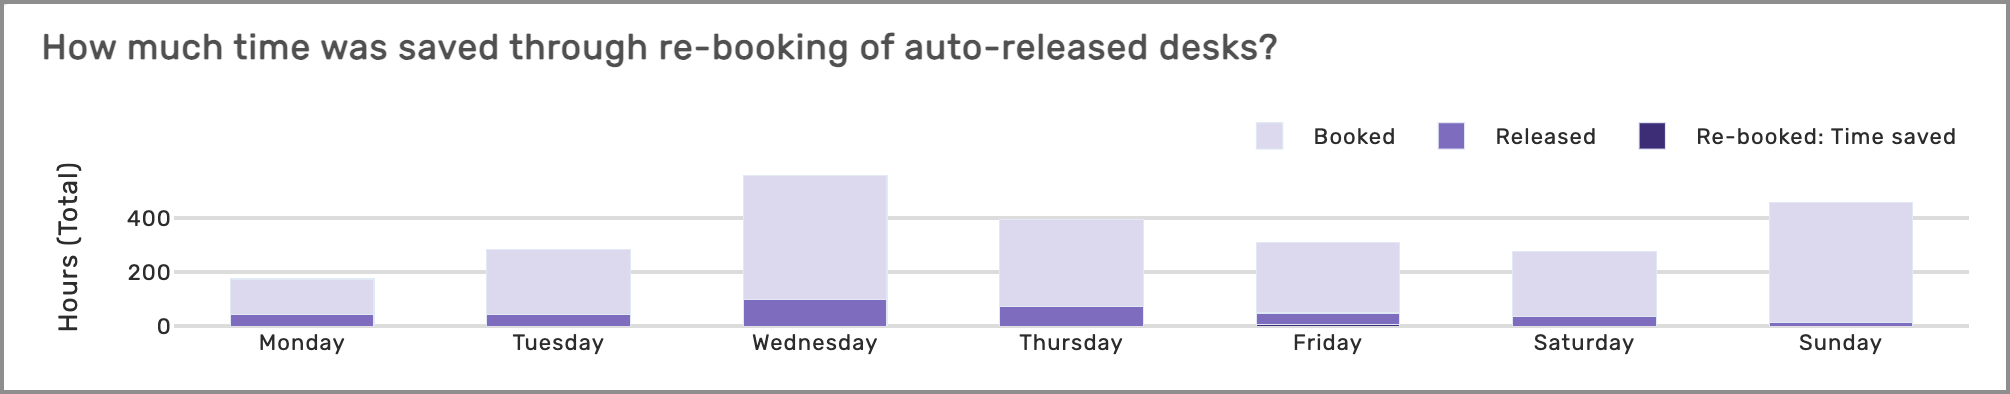
Amount of time saved through re-booking of auto-released desks
Chart shows the number of hours per day that were released when the user did not check in and desks were made available again for booking.
|
|
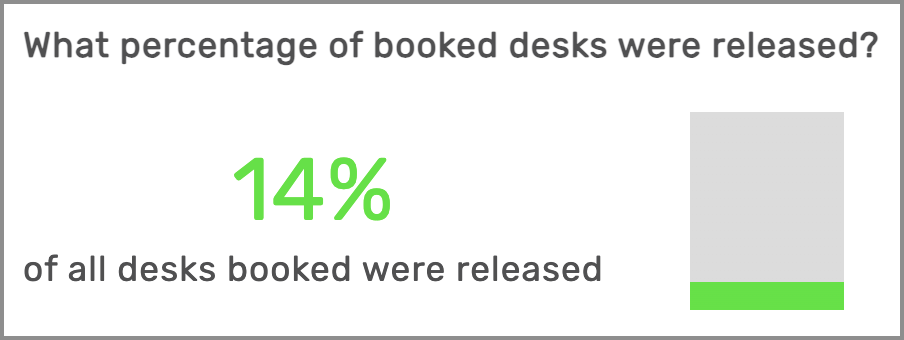
Percentage of booked desks released
Percentage of desks that were released within the parameters selected.
|
|
|
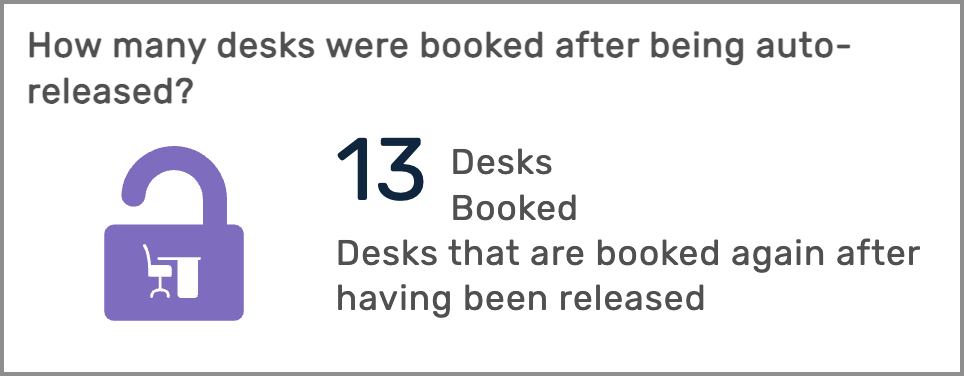
Number of desks booked after being auto-released
Provides an at-a-glance view of the number of desks that were booked again after they were auto-released.
|
|
If View Future Booking is Enabled
|
|
 |
|
Number of future desk bookings
Displays the total number of desk bookings and the number of unique users for the selected future dates.
|  |
| |
All Insights Dashboards

