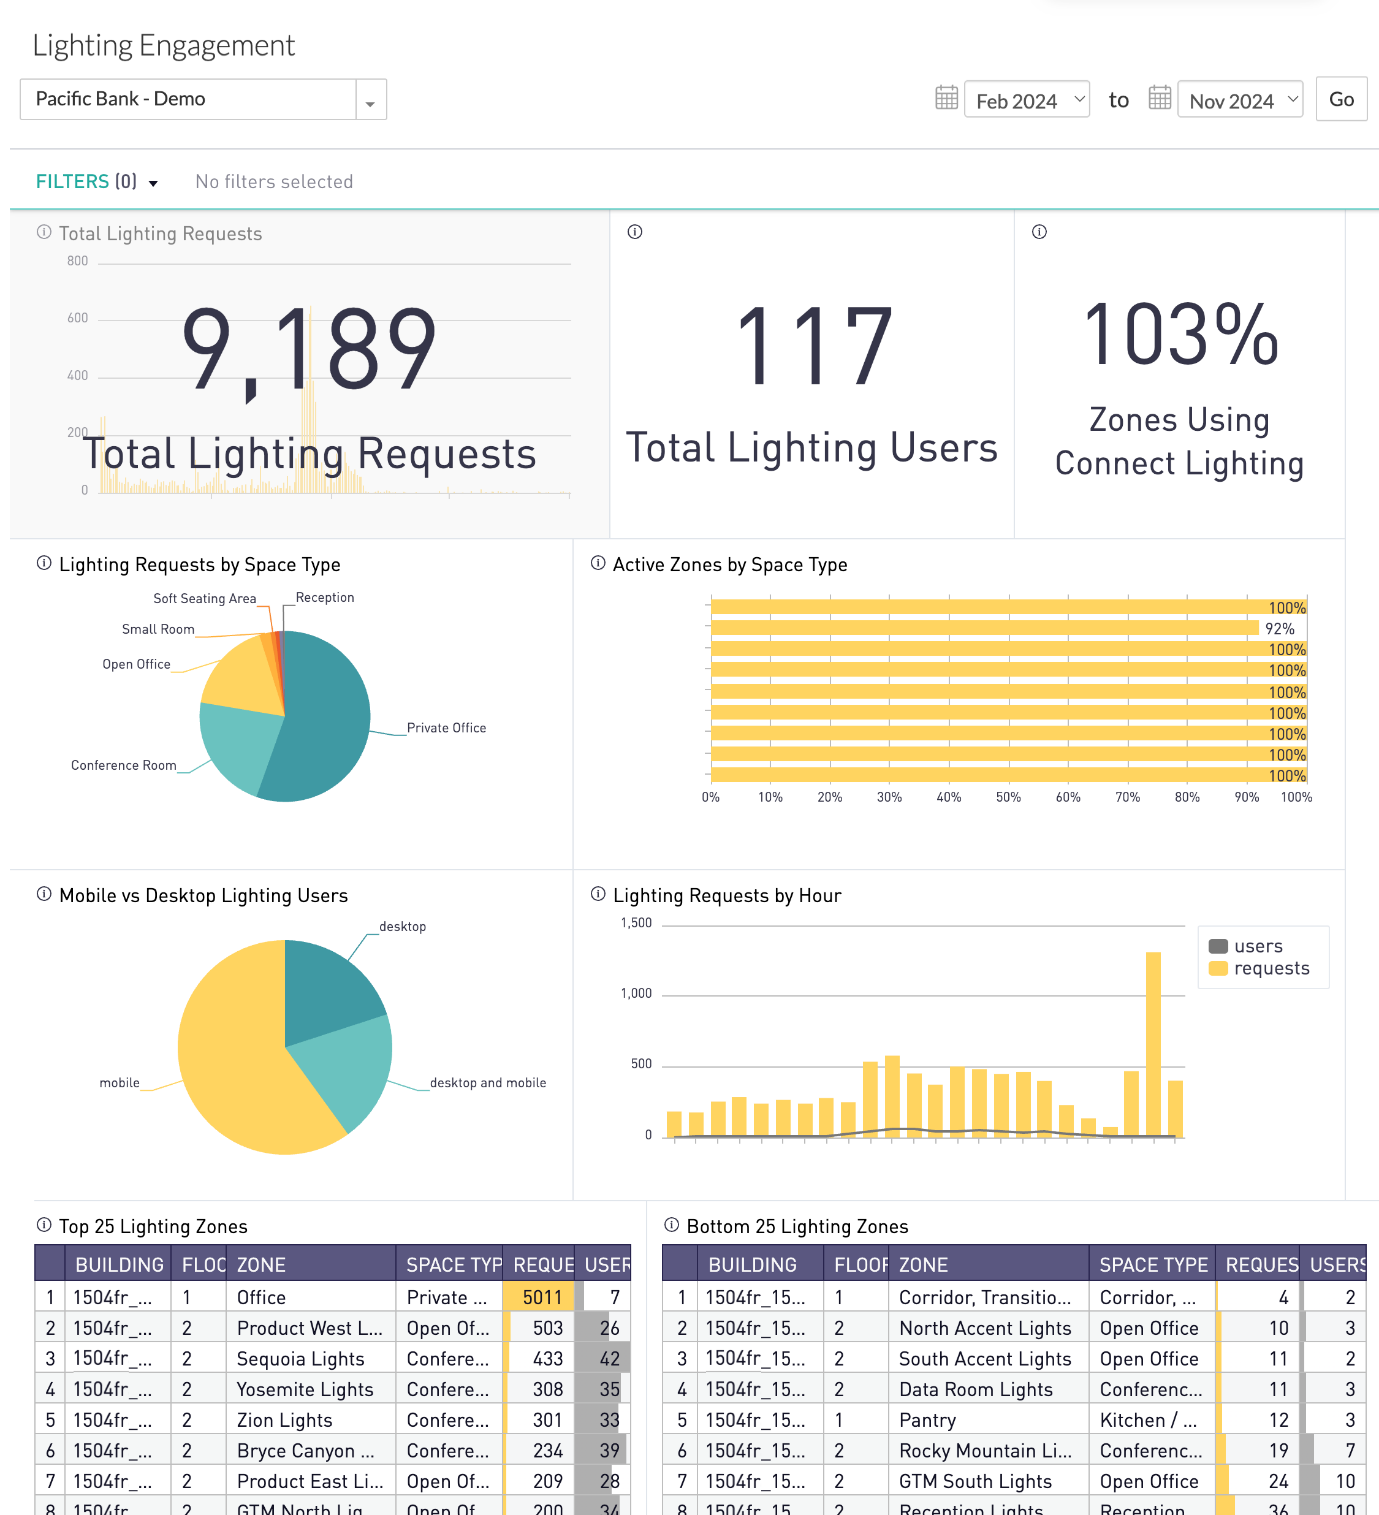
Administrators can use the Lighting Engagement dashboard to understand the level of employee engagement with the lighting control feature:
- Number of lighting users and requests over space types
- Engagement metrics on active usage over zones and settings
This dashboard provides filters to narrow the reporting data by Building, Floor, and date range. Data displays all distinct users, based on the filters.
Available Insights will vary based on what features have been implemented.
Navigate to the menu item > Lighting Engagement 
View the Available Metrics.
INSIGHTS – Available Metrics
The data includes information up to the end of the previous day.
|
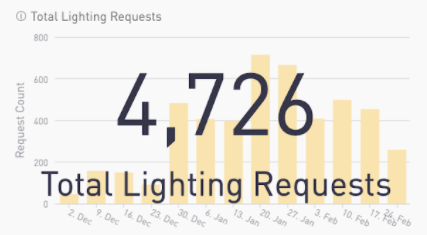
Total Lighting Requests
Displays the number of lighting requests by week over time.
Number in overlay shows the cumulative total in selected time frame.
|
|
|
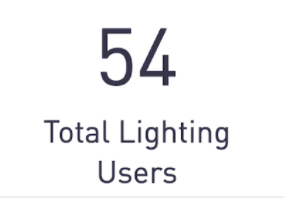
Total Lighting Users
Displays the number of distinct users who have made lighting requests.
|
|
|
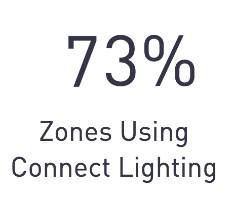
Zones Using Connect Lighting
Displays the percentage of zones with a request. The total number of zones is the number of visible, not disabled zones.
|
|
|
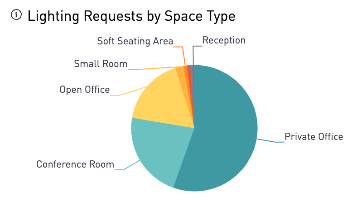
Lighting Requests by Space Type
Pie chart shows the distribution of space types where requests are made.
|
|
|
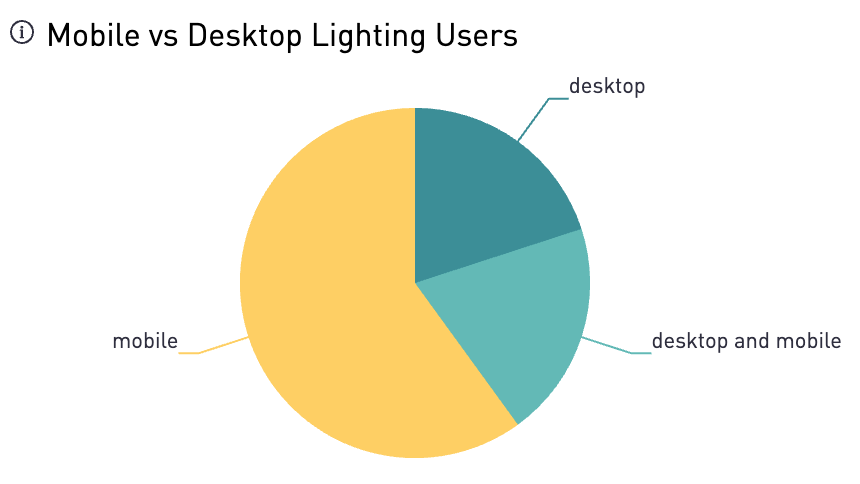
Mobile vs Desktop Lighting Users
Pie chart shows the distribution of platform usage by work request users.
|
|
|
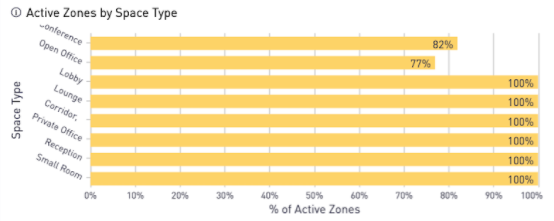
Active Zones by Space Type
Bar chart shows the percentage of zones with a request by Space Type. The total number of zones is the number of visible, not disabled zones.
|
|
|
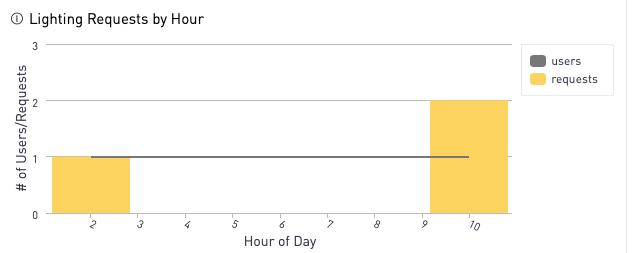
Lighting Requests by Hour
Bar chart shows the total lighting requests and users per hour.
|
|
|
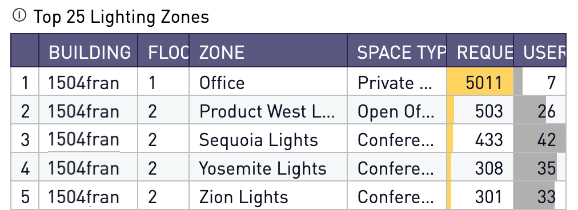
Top 25 Lighting Zones
Table includes the number of requests and users in the 25 most used zones.
|
|
|
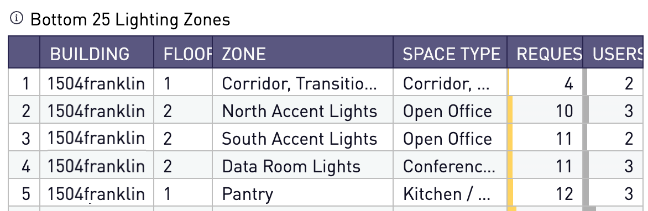
Bottom 25 Lighting Zones
Table includes the number of requests and users in the 25 least used zones.
|
|
| |
All Insights Dashboards

