To view the list of the events, and where appropriate, the possible action(s) that the Energy Manager (EM) administrator should pursue to resolve each fault condition, refer to the article Monitoring Events.
Events are displayed by;
Clicking on a profile or a facility item and then clicking the Events tab. On the screen is a table of events associated with the profile or facility item. The screen also includes filtering and actions. The following is an example of the events screen:
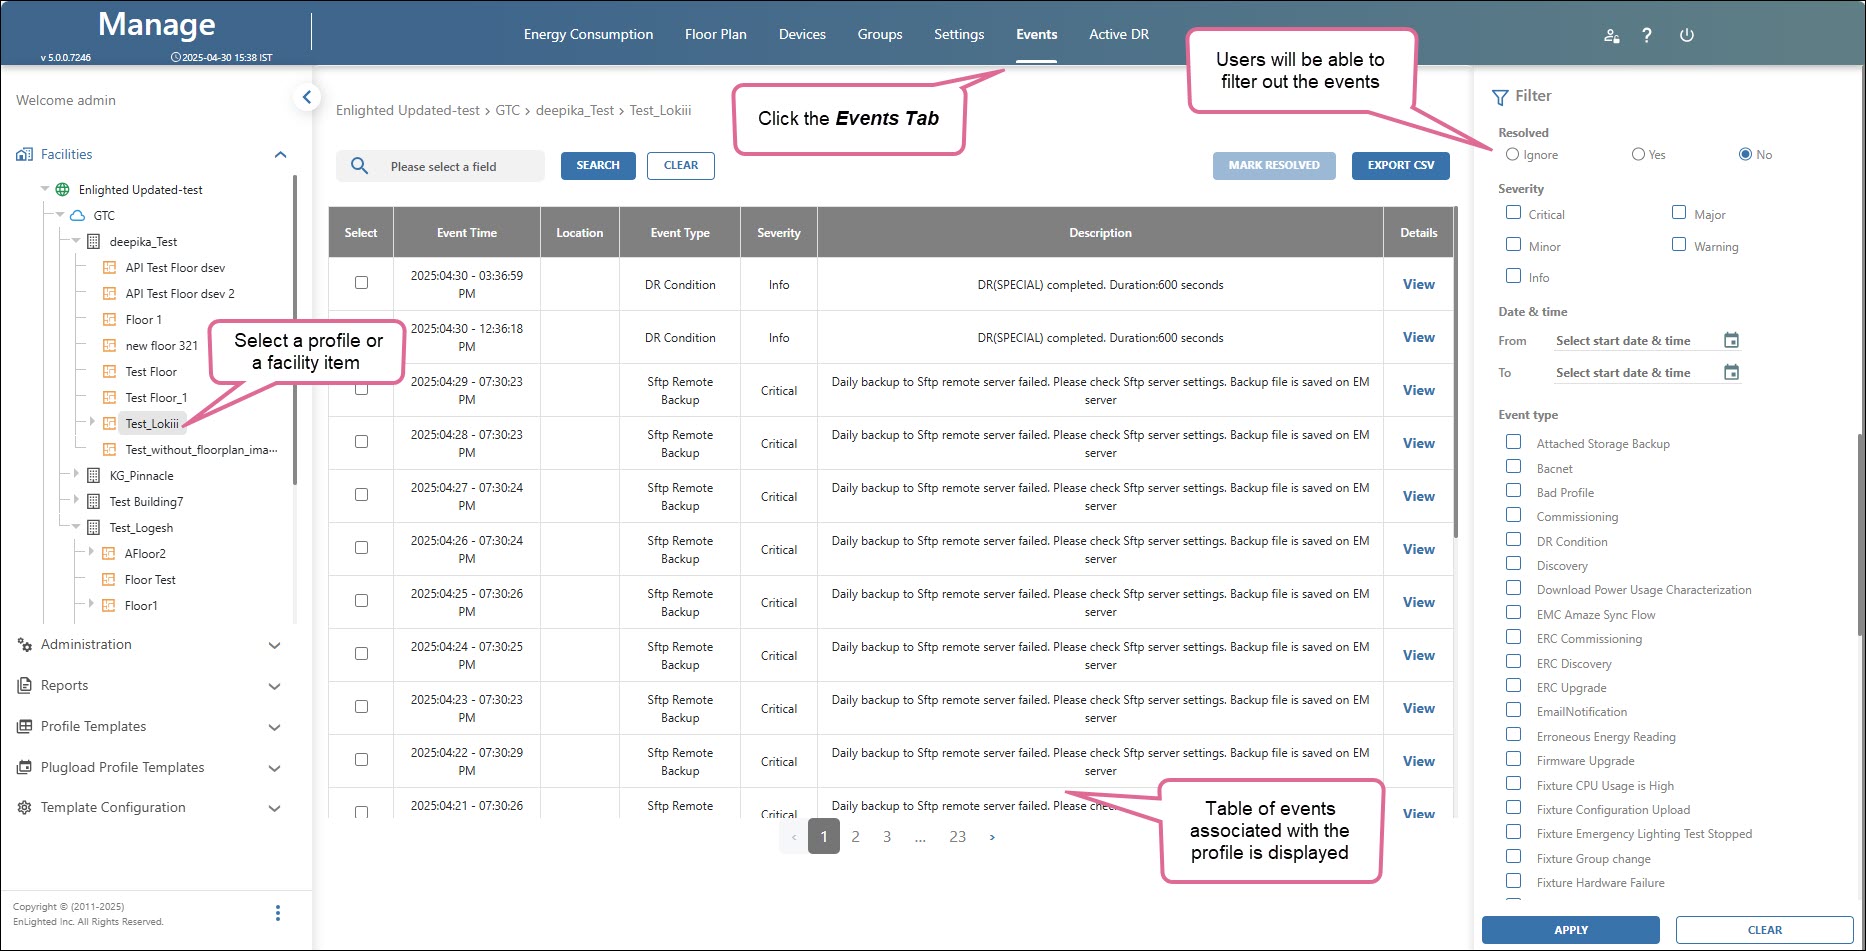
At the top of the Events screen is a checkbox to include resolved events. By default, resolved events are not shown.
The Filter section may be shown to choose additional criteria to be used to select which events to include in the table. The filter section is shown or hidden by clicking on the >> Filter label.
The section without any changes is shown below:
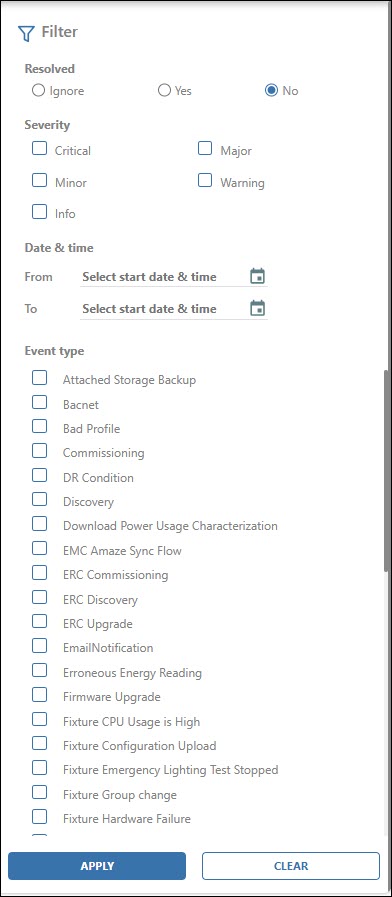
The attributes that must match are selected, and the Apply button is clicked to show only those matching events.
Events can also be received as an email notification, refer to the article Receiving Email Notifications.
Recommended articles:

